Monitoring is a verb. Observability is a property.
The difference is not marketing. Monitoring is an activity: collecting predefined metrics against known thresholds. Observability is a property from 1960s control theory: how well internal state can be reconstructed from external outputs. On known unknowns, the cardinality tax, the three pillars myth - with a day of our own production telemetry as the exhibit.
Published
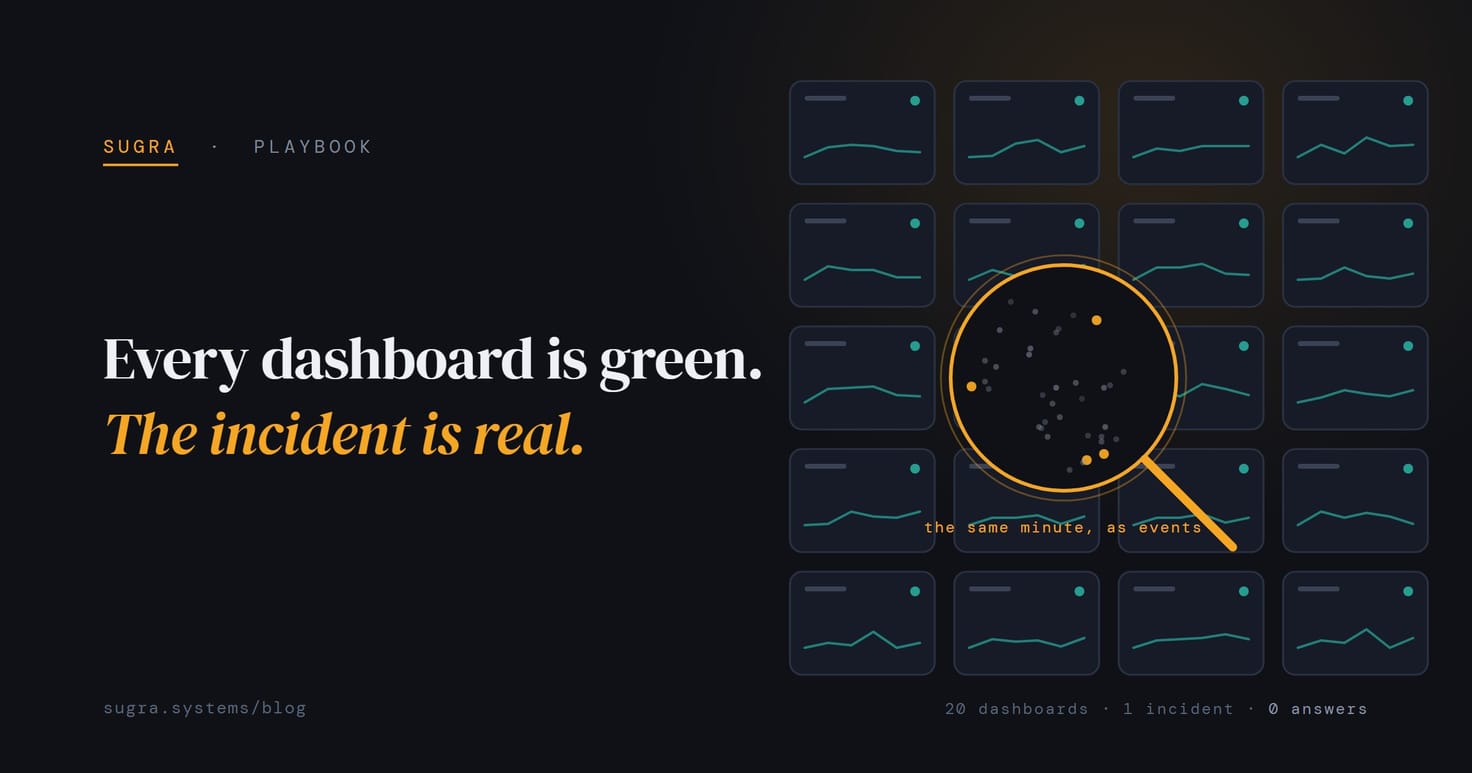
The accusation writes itself: observability is monitoring after a rebrand, sold back to you at a higher per-gigabyte rate. It is worth taking seriously, because for plenty of vendor decks it is true. But the original distinction is real, and it lives in two places the decks rarely visit: control theory and the shape of your data.
A verb and a property
Monitoring is an activity. You collect predefined metrics, aggregate them, draw them on dashboards, and compare them against thresholds you chose in advance. It watches the system from outside and answers one question: is it healthy, relative to what we expected to go wrong?
Observability is not an activity - it is a property of the system, borrowed from Rudolf Kalman’s control theory work around 1960: a system is observable to the degree its internal state can be reconstructed from its external outputs. Not “do we have graphs” - can you, holding only the telemetry, figure out what is happening inside without shipping new code to find out.
The practical difference fits in one sentence: monitoring tells you the service is down; observability lets you ask why - drilling into the context of one specific request without deploying a new build with more logging.
Known knowns, unknown unknowns
The watershed is the kind of question you can ask.
Monitoring covers the known knowns. You know the disk can fill, the CPU can saturate, latency can climb - so you write checks and dashboards for the failures you predicted. Static answers to pre-asked questions, and for those failures it is exactly the right tool.
Distributed systems fail differently. Most serious incidents in a microservice architecture never repeat the same way twice, and you cannot pre-build a dashboard for a bug that only manifests as Android v10 plus one region plus one feature flag plus a rare race condition. Observability is the ability to ask a new question of the system, right now, without having predicted it - to slice the telemetry along an arbitrary dimension until the needle falls out of the haystack.
The cardinality tax
The technical wall between the two is cardinality. Traditional metrics work because they aggregate: a counter per endpoint compresses beautifully into a time series database. But aggregation destroys context. You can see that p99 latency rose; you cannot see that every slow request shares one build_id, one customer_uuid, one cart - because those dimensions were averaged away at write time.
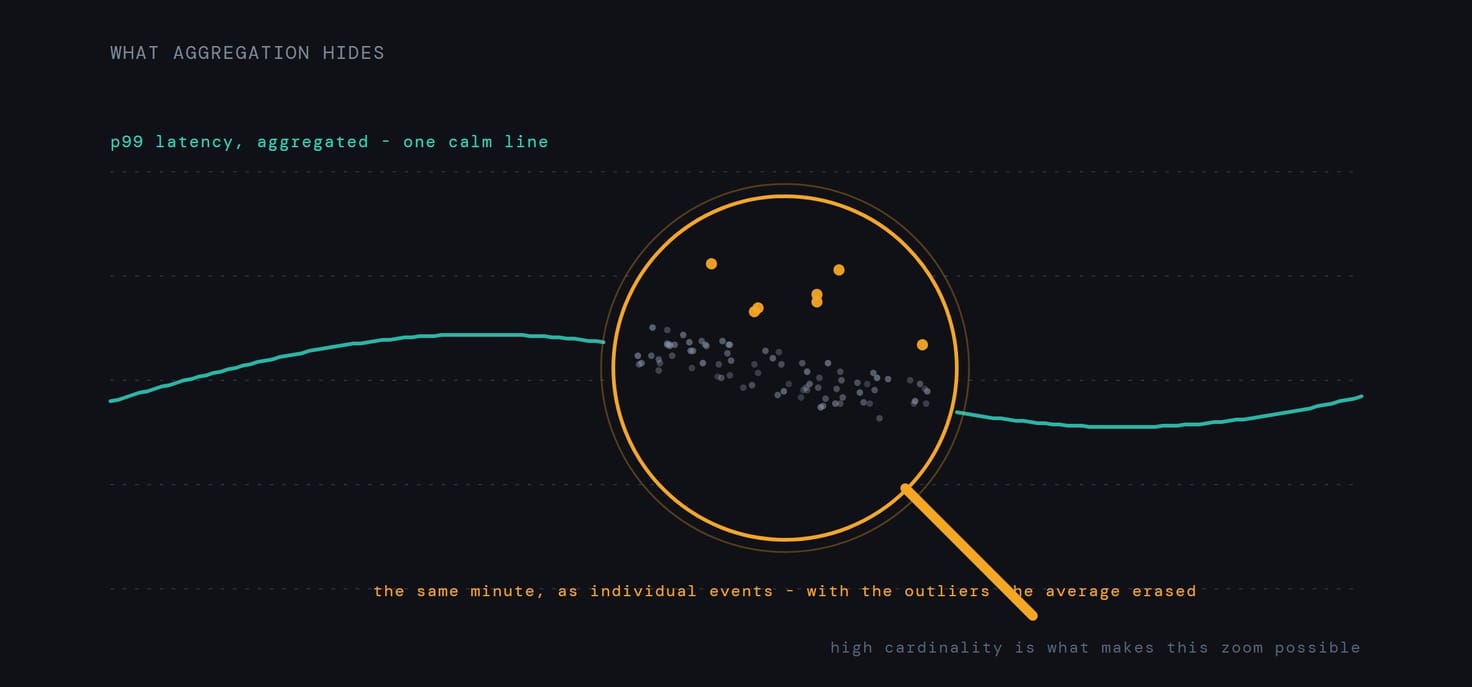
The same minute, twice: as an aggregate, and as the events the aggregate was made from.
High-cardinality dimensions - request_id, customer_uuid, cart_id, millions of unique values - are precisely what classic time series storage cannot afford: every unique label combination is a new series, and the bill grows accordingly. Observability tooling inverts the data model: store wide structured events - one record per request per service, with dozens or hundreds of attributes - and aggregate at query time instead of write time. Nothing is averaged away, so any dimension can become the group-by key during the incident, not before it.
A day of our own traffic
Here is what the gap looks like on real data - one day of production requests to our API, straight from our telemetry:
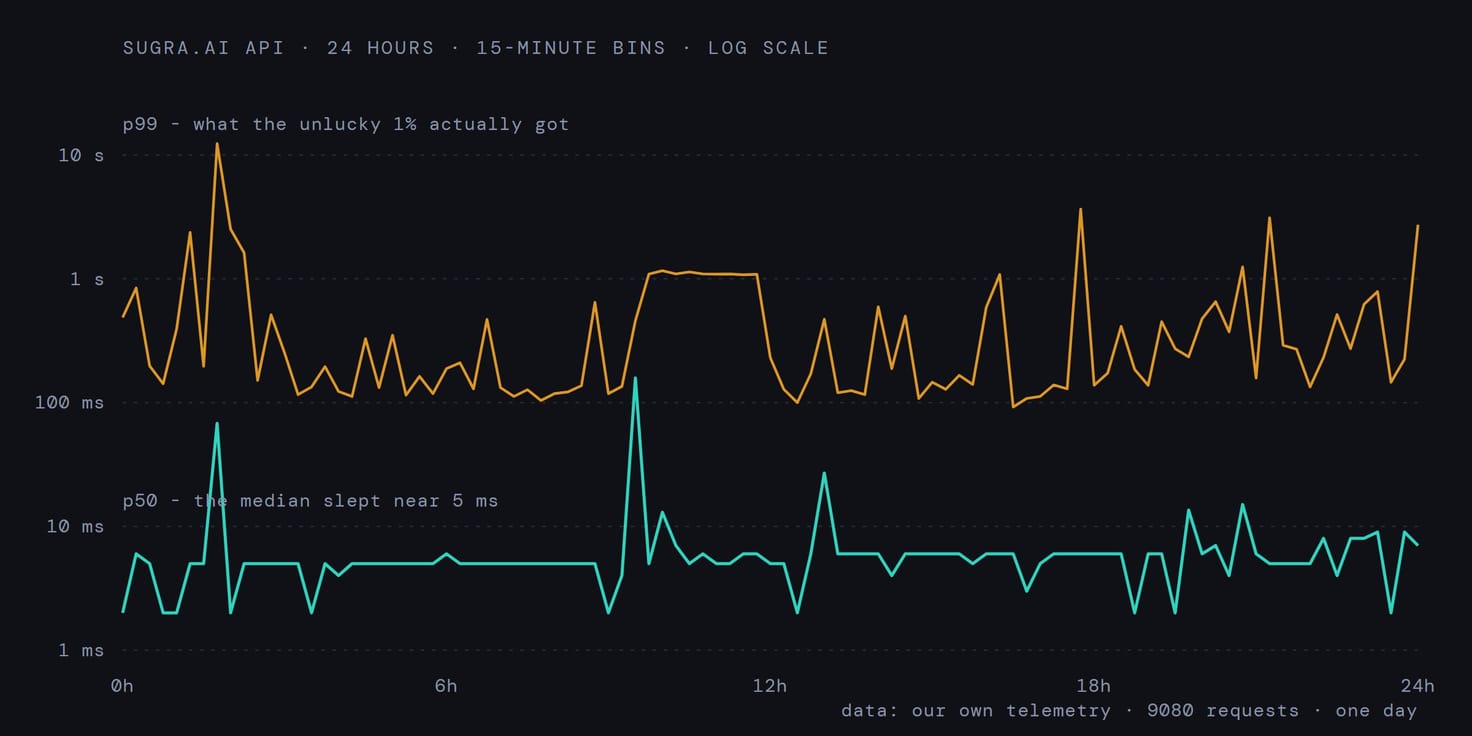
9,080 requests in 15-minute bins, log scale. The median slept near 5 ms all day. The 99th percentile lived a different day entirely - cold starts and heavy endpoints away from 12 seconds.
Both lines are true. If your alerting watches the median, this day looks perfect; the unlucky 1% would not agree. And the follow-up questions - which endpoints, which keys, which regions make up that amber line - are exactly the questions an aggregate cannot answer and an event store can.
In the spirit of observability honesty: our own status page lives at status.sugra.ai, we are still finishing the services, and there is no official maintenance window yet - so what it shows is what there is.
The debugging loop inverts
The workflow difference during an incident is the whole sales pitch, so it deserves stating plainly.
Before: open twenty dashboards, visually correlate spikes, guess, add a print statement, deploy, wait, repeat until morale runs out.
After: see the anomaly, group errors by build_id, notice they all sit in the canary release, filter by customer_tier, find that only enterprise tenants with one config flag are affected. Four questions, each asked after seeing the previous answer - none of them predicted in advance. That iterative narrowing is the observable-system loop, and it is only possible when the data kept its dimensions.
The three pillars myth
The industry summary says observability equals logs plus metrics plus traces. Having all three guarantees nothing. Three disconnected stores with three query languages is just monitoring with a bigger invoice - during an incident you become the join engine, copying request IDs between tabs.
Observability is achieved when you can move seamlessly: from the metric that alarmed you, to the traces behind that exact spike, to the structured events of one request - with the execution context preserved across every hop. Conceptually one event store wearing three query hats, not three databases wearing one marketing hat. OpenTelemetry made the plumbing portable - one SDK, shared context propagation across services - but it standardizes transport, not insight. The instrument is not the observability; the ability to ask is.
Where the pager fits
None of this retires monitoring. Predictable failures deserve cheap, boring, predefined checks - and the pager should ring on symptoms users feel, budgeted the way we wrote about SLOs in June: alert on burn rate, not on CPU. Monitoring pages you; observability is where you go when the page arrives with a question the dashboards cannot answer.
A dashboard is an answer someone wrote down last quarter. An incident is a question nobody has asked yet. Build for both, and know which one you are looking at.
Reading
- Observability Engineering - Charity Majors, Liz Fong-Jones, George Miranda, O’Reilly 2022: the book behind the discipline, including the case against the three pillars
- Monitoring Distributed Systems - Google SRE Book, chapter 6: the canonical case for symptom-based alerting
- OpenTelemetry - the open standard for traces, metrics and logs with shared context
- R. E. Kalman, “On the General Theory of Control Systems,” 1960 - where the word observability actually comes from