Who uses AI in 2026, Country by Country
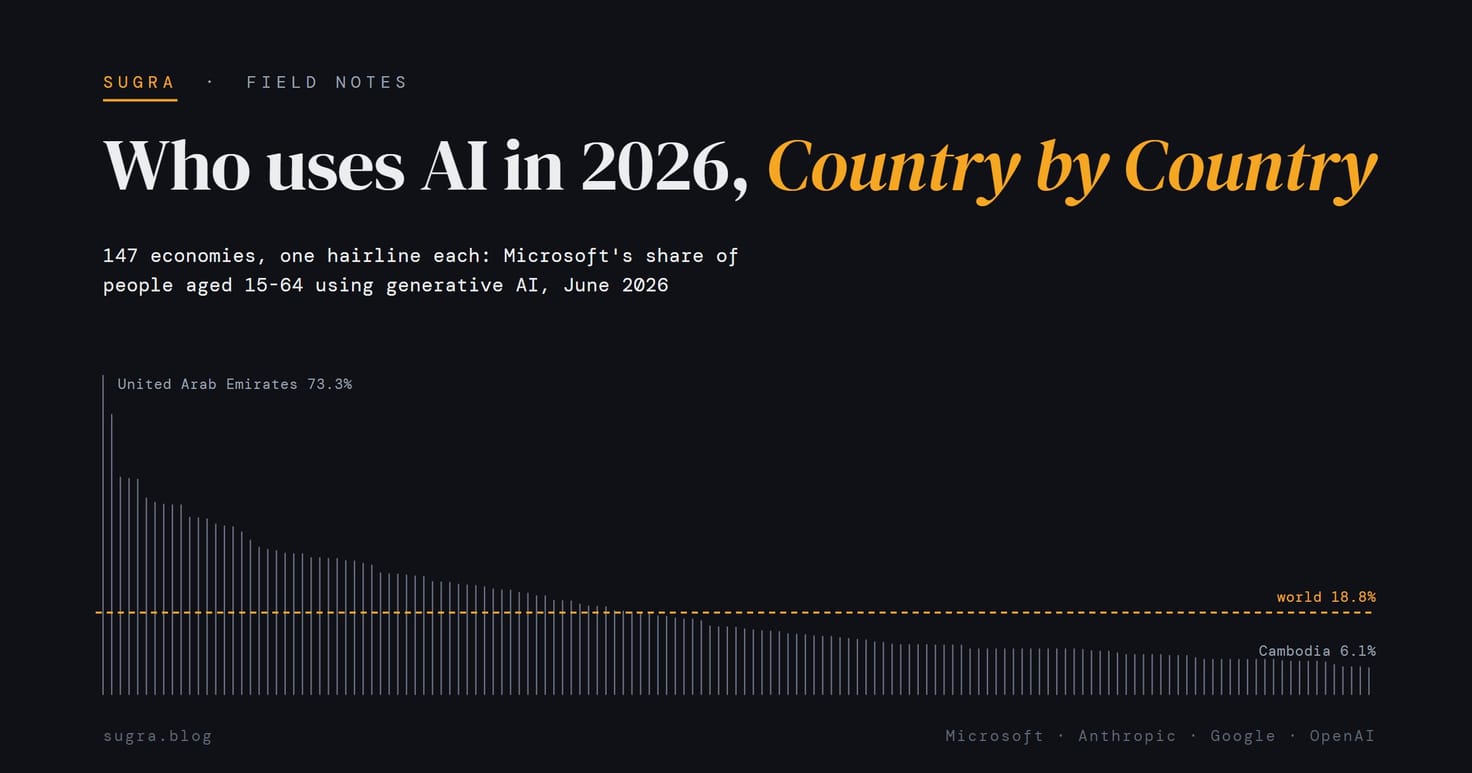
I wanted to understand how widely people actually use AI around the world. Microsoft puts the figure at 18.8% of people aged 15 to 64. But compare its country rankings with Anthropic, Google and OpenAI, and some countries move quite a bit. I put the four datasets side by side to see where they agree and what might explain the differences.
Published
18.8% of the world, and the gap is growing
The widest count comes from Microsoft. Its AI Economy Institute publishes the Global AI Diffusion Report every quarter, and the measure is simple to state: the share of people aged 15 to 64 who used a generative AI product during the period. In the second quarter of 2026 that share was 18.8% of the world. A year earlier, in the first half of 2025, it was 15.1%.
Microsoft splits the world into a Global North and a Global South. Both groups are using AI more, but the gap between them has grown. From the first half of 2025 to June 2026 the Global North went from 22.9% to 28.8%, while the Global South rose from 13.1% to 16.2%. The gap widened from 9.8 to 12.6 percentage points.
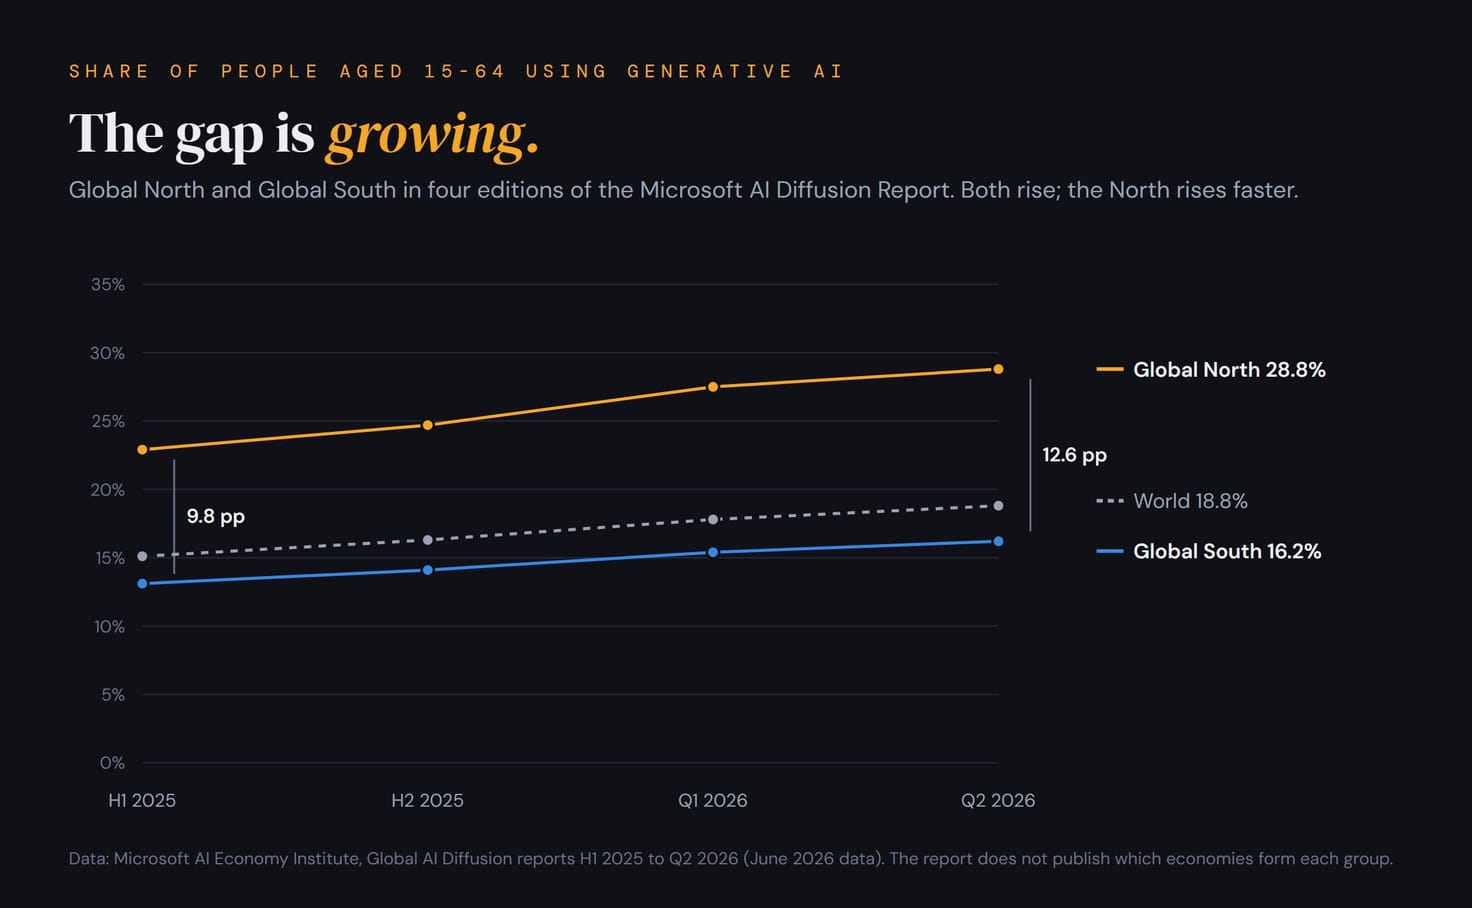
Figure 1. Both halves of the world rise; the richer half rises faster. Data: Microsoft AI Economy Institute, Global AI Diffusion reports H1 2025, H2 2025, Q1 2026 and Q2 2026. The report does not publish which economies form each group.
Microsoft points to familiar problems: electricity, internet access, digital skills and support for local languages. Internet access is the most basic of them. The ITU counts 74% of the world online in 2025: 94% of people in high-income countries, 23% in low-income ones, 36% in Africa. Someone who is not online cannot use a chatbot at all. In Microsoft’s technical paper, Pakistan’s 10% of the population becomes 33% when only the people who are online are counted.
Four companies, four ways of counting
Microsoft is not the only source. Anthropic, Google and OpenAI also publish country data, and each of them counts something different.
Microsoft estimates a share of people. It starts from anonymised Windows telemetry that records visits to 19 AI sites and apps, among them ChatGPT, Gemini, Claude, Copilot, DeepSeek, GigaChat and Alice, then adjusts for device market share, internet use and population. 147 economies, June 2026. Microsoft’s technical paper is open about the limits: the method is “inherently biased toward desktop platforms”, it assumes that Microsoft users behave like everyone else, and “in some countries - like Russia, Iran, and partly China - telemetry data is limited.” Where most users in a country switch off diagnostic data, as in parts of Europe, the estimate is blended with the global average.
Anthropic publishes the Anthropic Economic Index. Its country measure, the Anthropic Usage Index, divides a country’s share of Claude usage by its share of the world’s working-age population. An index of 1.0 means usage exactly proportional to population; 2.0 means twice the expected share. It covers Claude.ai chat and Cowork on the Free, Pro and Max plans, not the API and not Claude Code. 121 countries, May 2026.
Google publishes the AI and Economy ATLAS. It counts conversations in the Gemini app and in AI Mode in Search, about 14.65 million sampled interactions from 6 to 19 April 2026, per person and adjusted for how widely Gemini is used in each country. The result is not a number but a group from 1 (Very Low) to 5 (Very High). The thresholds are not published, and the groups are not equal: 30, 30, 29 and 30 countries in groups 5 to 2, and 99 in group 1.
OpenAI publishes Signals, version 3.0, under a CC BY 4.0 licence. It ranks countries by ChatGPT messages per person. Only consumer accounts count (Free, Go, Plus and Pro), with no enterprise use and no Codex, and the file carries the rank alone, without the value behind it. 173 countries, third quarter of 2026.
So there is a percentage of people, an index of intensity, a group of five and a rank, with different product coverage and reporting periods. These numbers answer different questions. I compared the country rankings, keeping each source’s original measure alongside them.
Across the countries they share, the rankings broadly agree. Anthropic and OpenAI are the closest. Google and OpenAI differ the most.
| Pair | Countries in both | Rank correlation (1 = same order) |
|---|---|---|
| Anthropic and OpenAI | 121 | 0.91 |
| Microsoft and Anthropic | 109 | 0.86 |
| Microsoft and OpenAI | 137 | 0.84 |
| Microsoft and Google | 142 | 0.81 |
| Anthropic and Google | 121 | 0.72 |
| Google and OpenAI | 173 | 0.60 |
109 countries appear in all four.
Who leads: small, rich and connected
Microsoft’s top of the table belongs to the United Arab Emirates at 73.3% and Singapore at 64.3%. Ireland (49.9%), France (49.6%) and Norway (49.4%) follow, then Spain, New Zealand, the United Kingdom, the Netherlands and Qatar. The United States is 21st with 33.0%. Germany is 23rd, Japan 45th.
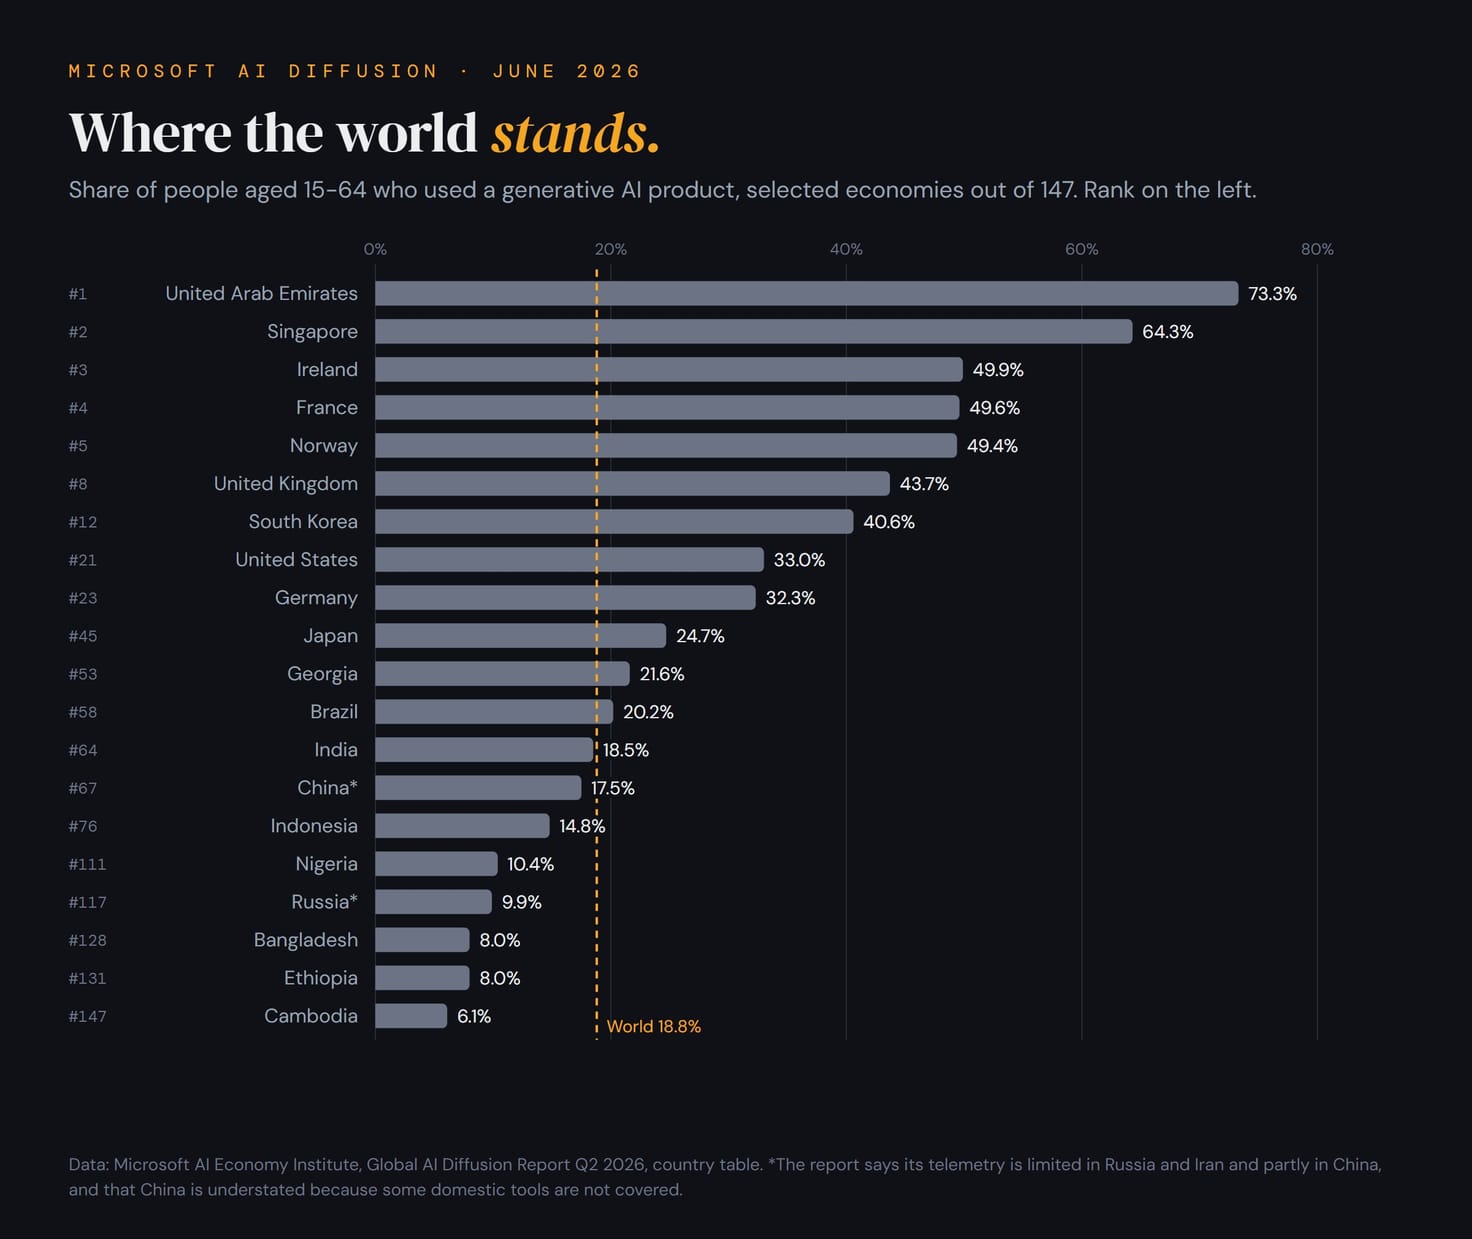
Figure 2. Twenty of 147 economies, with the world average as a dashed line. Data: Microsoft AI Economy Institute, Global AI Diffusion Report Q2 2026, country table.
The leaders are small, rich, well connected and, in several cases, pushed by the state. Microsoft’s reports trace the UAE’s lead to a policy line that began in 2017 with a Minister of State for AI. South Korea is the fastest climber among large economies: up 9.9 points since the second half of 2025, and from 25th to 12th place over the last three editions, with a national AI strategy, a new AI Basic Act and much better Korean-language models cited as causes.
The other three lists tell a similar story with different names at the top. Anthropic’s index is led by Australia (6.40), Singapore (5.81), Switzerland (5.02), Luxembourg and New Zealand; the United States is 12th at 3.87. OpenAI’s ranking starts with Azerbaijan, Singapore, the Netherlands, Estonia and Montenegro; the UAE is 10th and the United States 49th. Google’s Very High group holds Australia, Germany, South Korea, the UAE, Singapore, Denmark, Norway, Sweden and the three Baltic states, and also Brazil, Poland, Serbia and Bosnia, countries that rank lower elsewhere. Google counts only its own products, and their reach differs from country to country.
Singapore is near the top of every list: second for Microsoft, Anthropic and OpenAI, and Very High for Google.
Microsoft’s lowest values are Cambodia (6.1%), Turkmenistan, Tajikistan and Afghanistan (6.3% each), Cuba (6.8%) and Syria (7.4%). Anthropic’s lowest are Tanzania (0.07), Mozambique (0.08) and Madagascar (0.10). OpenAI’s last places are Chad, Niger and South Sudan. Google writes that Sub-Saharan Africa and parts of Central and South Asia sit in the Low and Very Low groups, “where infrastructure bottlenecks and physical connectivity limitations likely restrict baseline access.”
The United States produces 20.2% of all Claude.ai usage. India is second, with 7.1% of the global total, but its usage index is only 0.30. Both can be true: a country can generate a lot of traffic while usage per person remains low. Google sees the same in India and Russia: “despite their large populations and large contributions to the global STEM graduate population”, both “fall into the ‘Low’ tier.” Google also finds that usage rises with income, and adds that “this analysis does not establish direct causation.”
Where the datasets have blind spots
Coverage gets patchy in China, Russia, Belarus and Iran. Some of the services are not available there, some local products are not in the data, and VPNs make location harder to interpret.
China. Microsoft puts China at 17.5%, 67th of 147, and warns that the figure is understated because domestic tools are not covered. Anthropic and OpenAI do not offer their products there and have no Chinese row; Google offers Gemini in mainland China only through Workspace and leaves China out. The Chinese count is very different. The state internet agency CNNIC reported 602 million generative AI users, 42.8% of the population, at the end of 2025, and the analytics firm QuestMobile counted 499 million monthly users of AI-native apps in mid-2026. China is one of the largest AI markets in the world, and these four lists see a fraction of it.
Russia and Belarus. Microsoft shows Russia at 9.9% (117th) and Belarus at 10.3%, both with limited telemetry. Neither country is on Anthropic’s list of supported regions, neither is on Google’s list for the Gemini app, and OpenAI’s file has no row for either. Yet Google’s data places both in group 2, which means some Gemini traffic arrives anyway. Two things fill the gap. One is local and Chinese models: Microsoft’s list of 19 includes Yandex’s Alice and Sber’s GigaChat, and in its H2 2025 edition DeepSeek held 43% of measured AI use in Russia, 56% in Belarus, 49% in Cuba and 89% in China. The other is the VPN. In an April 2026 Russian Field poll reported by Carnegie, more than half of Russians aged 18 to 45 said they use one.
Iran. Microsoft has 12.8% (87th), again with limited telemetry, and the country has lived with heavy internet restrictions through 2026; Al Jazeera reported in April that most people still could not reach the open internet.
Anthropic’s supported-regions policy, in force from 12 November 2026, excludes Russia, Belarus, China with Hong Kong and Macau, Iran, North Korea, Syria, Cuba, Venezuela, Afghanistan, Myanmar and the occupied regions of Ukraine. It also excludes companies more than 50% controlled from those places, wherever they are registered.
A missing country tells us very little about how much AI people there use. VPNs add another complication. If location is assigned from the IP address, traffic can appear to come from the country where the VPN server sits. None of the four reports says how it handles such traffic.
When the lists disagree
The differences become more interesting when you look at individual countries. I turned each country’s position in the Microsoft, Anthropic and OpenAI lists into a percentile: the share of the other countries in that list ranked below it, so 100 is the top. Google’s five groups are too coarse for that, so for Google I show the group itself. Then I set thirteen countries side by side.
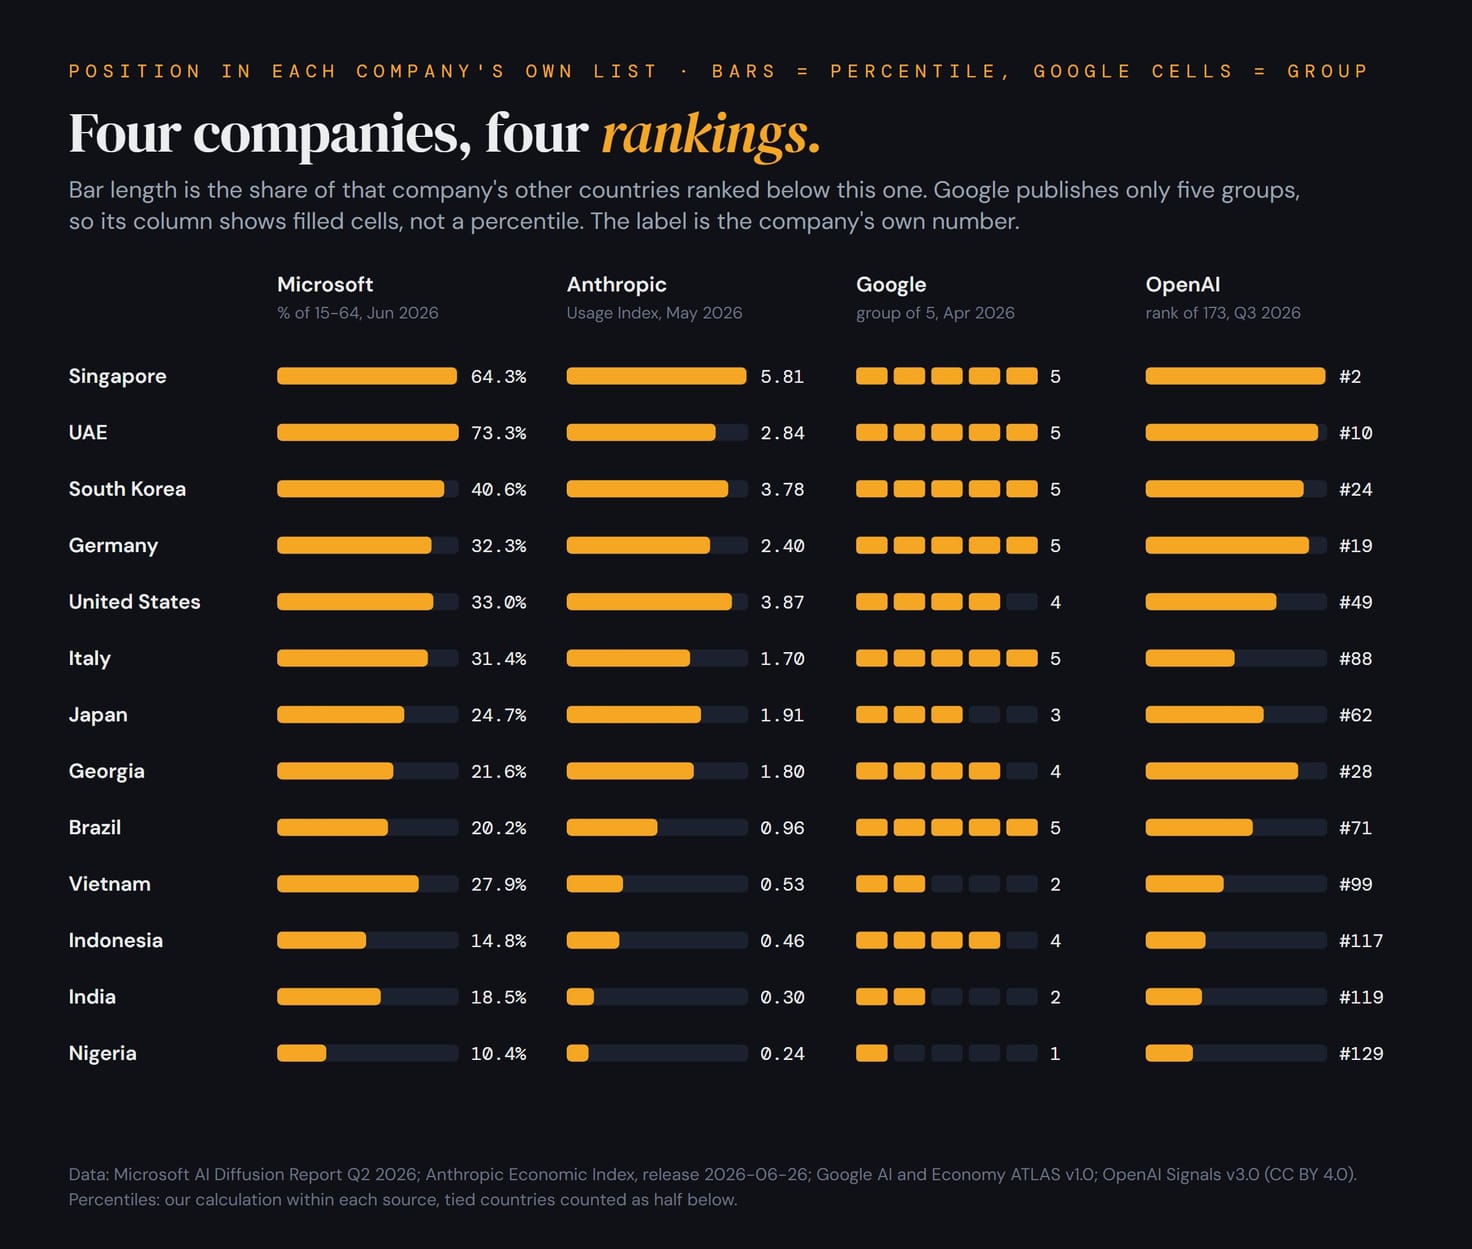
Figure 3. Bar length is the country’s percentile inside the Microsoft, Anthropic and OpenAI lists. Google’s column is not a percentile: it shows five cells, filled up to the country’s group. The label is that company’s own number. Data: Microsoft AI Diffusion Report Q2 2026; Anthropic Economic Index, release of 26 June 2026; Google AI and Economy ATLAS v1.0; OpenAI Signals v3.0. Percentiles are my calculation.
At the top the four agree: Singapore, the UAE, South Korea and Germany sit in the upper quarter of the Microsoft, Anthropic and OpenAI lists and in Google’s Very High group. So does the bottom: Nigeria is in the lowest third of those three lists and in Google’s lowest group. In between, single countries jump.
Brazil is in Google’s Very High group, 5 of 5, and in the middle of Anthropic’s index at 0.96, the 50th percentile. It is the clearest case of Google’s list placing a country higher than the others do.
Vietnam is the reverse case. Microsoft counts 27.9% of its working-age people as users, 33rd of 147 and the 78th percentile, well above the world’s 18.8%. The other three place it much lower: 0.53 on Anthropic’s index, the 31st percentile; group 2 of 5, Low, for Google; 99th of 173 for OpenAI, the 43rd percentile. Here Microsoft’s list is the one that places the country higher, and none of the reports says why.
The United States and Italy show the same gap for OpenAI. Both sit in the upper fifth of Microsoft’s list, at 33.0% and 31.4%, and Google has Italy in its Very High group. OpenAI ranks the United States 49th and Italy 88th of 173. Its list counts only consumer ChatGPT messages, without enterprise accounts, so it describes one product’s consumer use rather than a country’s use of AI.
India and Indonesia are ordinary on Microsoft’s measure of people, in the 57th and 49th percentiles, and low on Anthropic’s index, in the 15th and 29th. Microsoft estimates the share of people using the generative AI services it tracks; Anthropic’s index measures how much Claude is used per person. A country can be ordinary on the first and low on the second.
Georgia comes out above the middle in all four datasets. Microsoft puts it at 21.6%, above the world’s 18.8%; Anthropic’s index is 1.80; Google places it in the High group; and OpenAI ranks it 28th of 173. That gives me more confidence in its position, though it still does not explain the result.
I would be careful about attributing Georgia’s result to the migration from Russia, Ukraine and Belarus after 2022 alone. None of these datasets tells us how usage differs between people who moved to Georgia and those who already lived there. An illustrative scenario shows the possible size of the effect, not its actual size. By the figures of Geostat, the national statistics office, net arrivals of citizens of the three countries from 2022 to 2025, assuming all of them are of working age, equal about 4.4% of Georgia’s working-age population. Take them out and assume every one of them used AI, and Georgia’s share is 18.0%; assume half did, and it is 20.3%. Net migration over four years is not a count of who lived in the country in June 2026, and Microsoft’s figure is a modelled estimate rather than a count of users, so the scenario cannot say how much of Georgia’s number migration explains.
What people use it for
What are people actually doing with these tools? The answer also changes depending on which product you look at.
OpenAI classifies consumer ChatGPT messages as work-related or not. In September 2026, 32.2% of messages worldwide were about work. The share runs from 45.5% in Zimbabwe and 45.3% in Singapore to 12.9% in Iraq and Libya; the United States is at 33.1% and India at 30.9%.
Claude shows another side. In Anthropic’s data, software development takes a far larger share of Claude.ai requests in several middle-income markets than in the richest ones: 19.0% in Egypt, 18.7% in Türkiye, 18.0% in Vietnam and 16.2% in India, against 8.2% in the United Kingdom and 8.1% in the United States.
Google sees an inversion when it ranks countries by the share of conversations that are about work: “highly connected, high-income regions like the United States and the European Union fall into the lower quintiles of work-related use. Conversely, developing regions, most notably across Africa, surge into the top quintile of work-biased usage.” Microsoft finds something close in a subset of consumer Copilot conversations. In the Global South, self-directed learning takes a 29.2% larger share of conversations than worldwide, and schoolwork a 32.3% larger share. The report adds that this applies “only to the early adopters” in those regions and that “the data do not explain why”.
Google’s and Microsoft’s data point the same way: in regions where measured use is lower, a larger share of it is about work and learning, and where it is higher, more of it is personal. OpenAI’s numbers are more mixed. Singapore, near the top of every list, is also near the top for work.
Companies are a different question
I also looked at business adoption. Here the surveys ask whether a company uses AI, so the percentages need to be read separately from the consumer figures. Eurostat reports that 20.0% of EU enterprises with ten or more employees used AI in 2025, up from 13.5% a year before. Denmark leads with 42.0%, followed by Finland (37.8%) and Sweden (35.0%); Germany is at 26.0%, France at 18.2%, Poland at 8.4% and Romania at 5.2%. In the United States the Census Bureau’s Business Trends and Outlook Survey found 19.8% of firms using AI between December 2025 and May 2026, and 37% of firms with 250 or more employees.
When employees are asked about their own use, the figures are higher. The University of Melbourne and KPMG survey of 48,340 people in 47 countries, cited in the Stanford AI Index 2026, found that 58% of employees use AI at work, and more than 80% in India, China, Nigeria, the UAE and Saudi Arabia. Trust lags behind use: in the Ipsos AI Monitor 2026, 63% of adults in 32 countries say they use AI tools they do not fully trust.
One dollar price, very different incomes
The leading assistants charge the same dollar price in most countries: Claude Pro and ChatGPT Plus both cost $20 a month (Claude Pro is $17 a month on an annual plan). At $20 a month, a subscription costs $240 a year. By the World Bank’s figures for 2025, that is about 0.3% of gross national income per person in the United States, 2.3% in Brazil, 8.7% in India and 17.6% in Nigeria. GNI per person is a rough comparison of affordability, but it helps explain why a $20 subscription is a very different purchase in each country. Free tiers keep the tools within reach, while the paid tiers with the stronger models cost far more, relative to income, in much of the Global South. OpenAI’s cheaper Go plan, $8 a month in the United States and 399 rupees a month when it launched in India, is one answer to that.
What I take from this
For me, these rankings are a starting point when thinking about a product or a course. I still want to know who the users are, which tools they already use and what they struggle with.
Vietnam and Brazil are good reminders to check more than one source. For countries with limited coverage, I would also look for local data. And I would test the language myself on the tasks the product needs to handle: Google lists Urdu, Marathi, Tamil, Punjabi and Thai among the Gemini app’s languages, and Global-MMLU, a widely used multilingual benchmark of 42 languages, covers none of them.
How I did this
All data were collected in November 2026. I downloaded the country files rather than reading numbers off charts: Microsoft’s country table for 147 economies from its GitHub repository, Anthropic’s Claude.ai file from the June 2026 release of the Economic Index, Google’s ATLAS public data, and OpenAI’s Signals archive. I joined them by ISO country code. A country’s percentile within a list is (countries ranked below it + (countries tied with it - 1) / 2) / (countries in the list - 1) x 100, computed over every country that list reports: 147 for Microsoft, 121 for Anthropic and 173 for OpenAI. Rank correlations are Spearman’s, over the countries each pair shares, with tied values given their average rank; Google’s five groups tie heavily, which is why I show its group rather than a percentile. The migration scenario uses Geostat’s population and migration releases for 2022 to 2026. Income per person is the World Bank’s gross national income per capita, Atlas method, in current US dollars for 2025: $88,810 for the United States, $10,550 for Brazil, $2,760 for India and $1,360 for Nigeria.
Microsoft does not publish which economies form its Global North and Global South. Google does not publish the thresholds of its groups. OpenAI publishes ranks, not values. Where I cite a figure reported by the press rather than by its original publisher, the link says so.
Reading
- Microsoft AI Economy Institute, Global AI Diffusion Report Q2 2026 and the data repository.
- Anthropic, Economic Index, release of 26 June 2026, and the report Cadences.
- Google, AI and Economy ATLAS v1.0 and the full report.
- OpenAI, Signals v3.0, CC BY 4.0.
- ITU, Facts and Figures 2025: internet use.
- World Bank, GNI per capita, Atlas method (current US$).
- Stanford HAI, AI Index 2026, chapter 9: public opinion.
A personal update: in October we opened Sugra Systems Georgia LLC in Tbilisi, wholly owned by Sugra Systems, Inc. in the United States. We now have companies in both countries.