The volatility layer
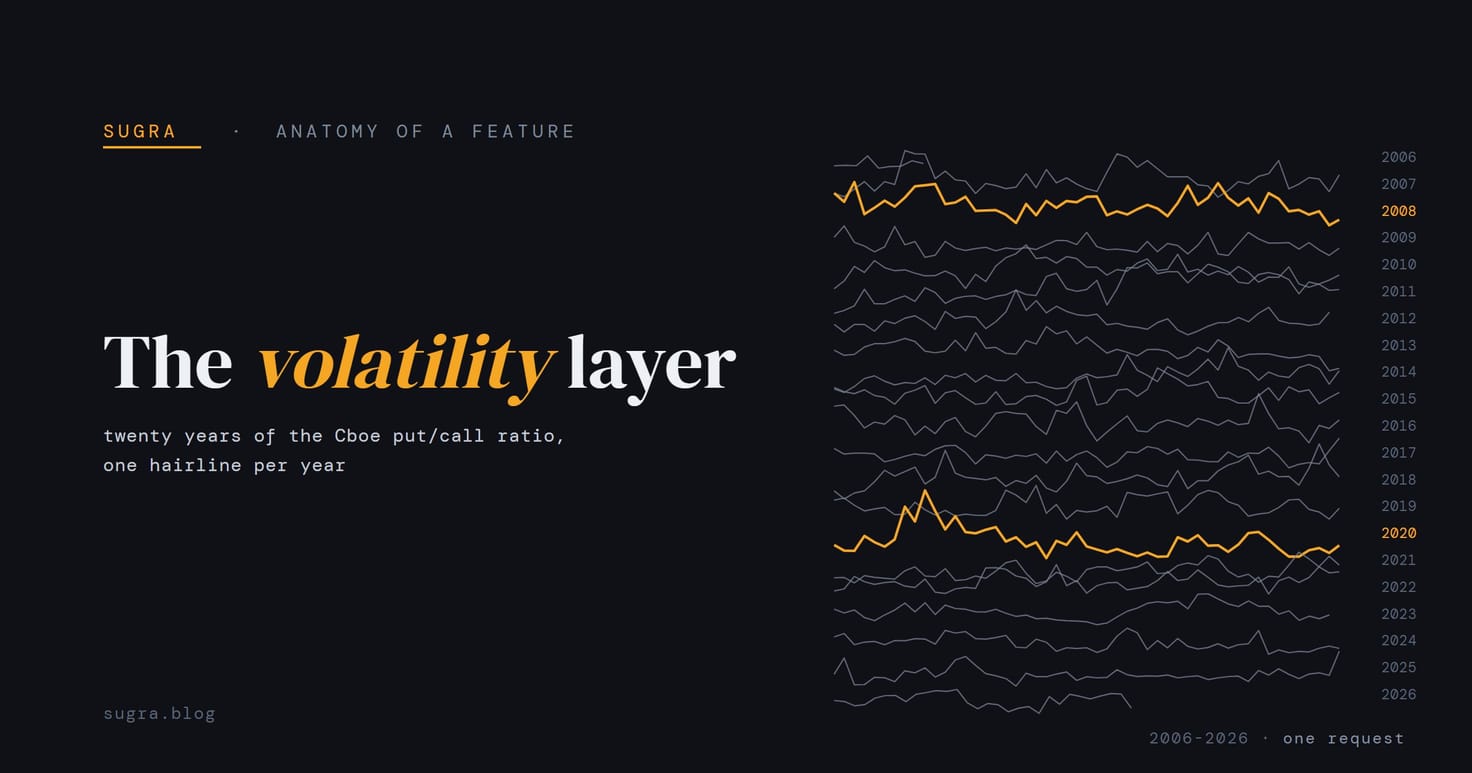
Six releases in one pass put a full volatility and options-statistics layer on Sugra Finance: the volatility futures curve, a six-tenor term structure, twenty years of Cboe put/call history, a 2,481-index catalog, per-minute options flow, and full-size cash-settled index chains. Notes on what shipped and on the data-honesty rules that shaped every endpoint.
Published
Six releases, one pass
Volatility was the quiet corner of Sugra Finance. We served the spot indices and a five-point term structure, and that was the polite way of saying: if you traded volatility rather than merely watching it, you went somewhere else.
That corner is now a layer. In one release pass, Sugra Finance gained:
- The volatility futures curve. The
VXroot joins/api/v2/futureswith the same four routes as every other root: the curve with a contango flag, the contract chain, per-contract daily history back to 2013, and contract metadata. Weekly expirations join the curve on request. - A six-tenor term structure. The ladder now starts at the 1-day tenor and runs to one year, fetched concurrently.
- Exchange-wide put/call statistics. The latest session’s ratios for every listed product family, with per-product volume and open interest - and a daily history stitched back to 2006.
- The full index catalog. 2,481 indices, paged and filterable, each with daily history on demand. The previous curated set was 35.
- Per-minute options flow. One-minute bars for any optionable US symbol with the options volume inside every minute: calls, puts, total.
- Full-size cash-settled index chains. S&P 500, Nasdaq-100 and Russell 2000 option chains with Greeks, an always-included expirations list, and expiry slicing so you take one expiration instead of thirteen megabytes.
One key, one envelope, one bill. Here is the shape of the new surface, and the engineering rules that made it slower to ship and better to use.
Twenty years of fear and greed in one request
The put/call ratio is the oldest sentiment gauge that still works: when puts outnumber calls, somebody is paying for protection. The numbers come from Cboe, and that matters more than a footnote suggests. Cboe opened as the Chicago Board Options Exchange in 1973, the first listed options market in the United States; it created the VIX in 1993, rebuilt the methodology with Goldman Sachs in 2003, and listed VIX futures in 2004. The volatility complex this layer serves is not measured at Cboe, it is defined there.
Which is why we take it first-hand. These are the venue’s own published statistics, read from the venue, not a vendor’s re-derivation of them. Nobody in the middle rounds a number, renames a field, drops a session or quietly restates last month. That is what data sovereignty means in practice: one hop from the source of record to your request, and a name you can check the numbers against.
Cboe publishes the daily statistics; what it does not publish is a continuous series. The modern feed starts in October 2019. Before that, the numbers live in frozen archive files that end, to the day, where the feed begins.
So we stitched them. The archives carry the series from 2006 (the S&P 500 family from 2010), the daily statistics carry it from 2019, and the seam is tested in CI against golden values measured on both sides. The result is one request:
BASE="https://sugra.ai/api/v1/cboe"
curl -H "x-api-key: YOUR_API_KEY" \
  "$BASE/put-call-ratio/history\
?family=total"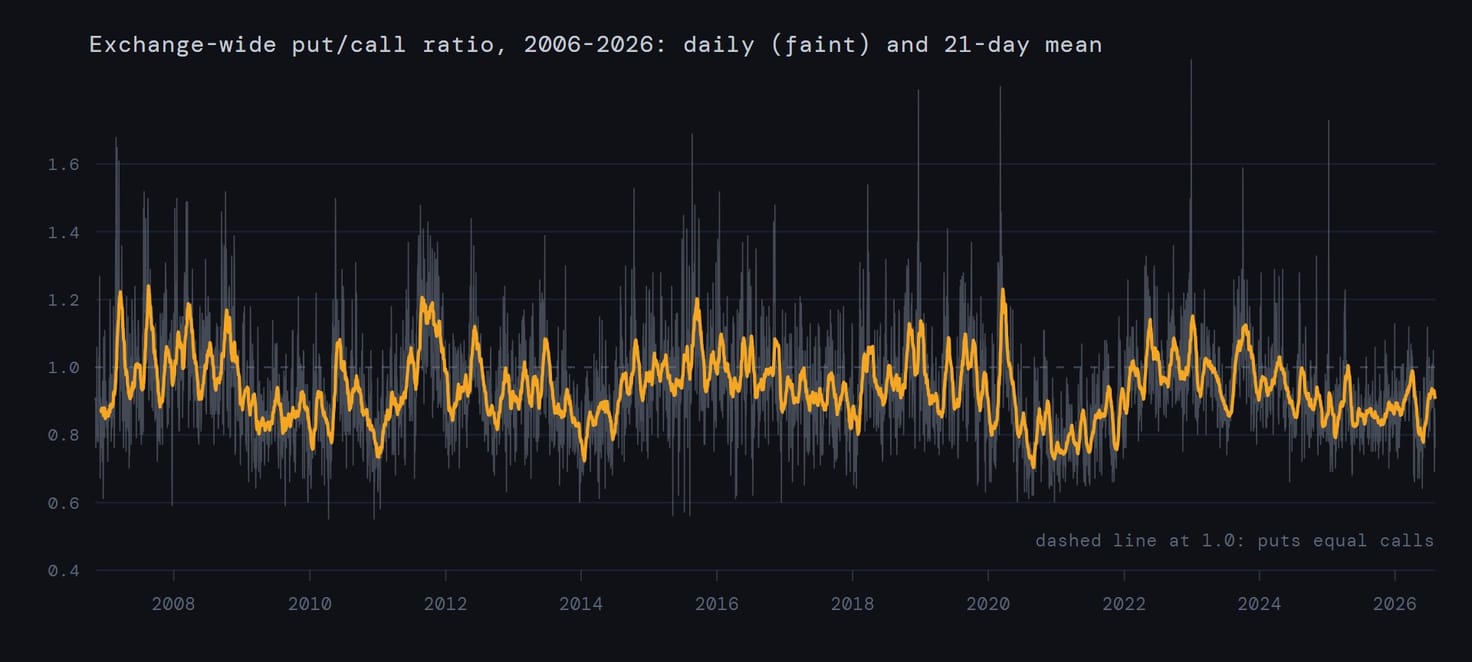
Data: Sugra API - one request, nothing else:
GET /api/v1/cboe/put-call-ratio/history?family=total.
Two decades of market mood: 2008 pinned above 1.0 for months, the March 2020 spike, and the long call-heavy drift since. Six families ship - total, index, equity, ETP, the volatility complex and the S&P 500 complex - each as its own continuous series.
The series is honest about its own seams. Where the reporting definitions
changed - exchange-traded products became their own category in 2012, the
source switches in 2019 - the payload says so, in a machine-readable
definition_changes block. A continuous line that quietly changes meaning
halfway through is worse than a gap; this one tells you where to be
careful.
The minute the index moved and the tape knew
The newest signal on the platform is also the fastest one: per-minute options flow.
curl -H "x-api-key: YOUR_API_KEY" \
  "https://sugra.ai/api/v1/cboe\
/intraday/_VIX"{
"time": "2026-08-07T09:31:00",
"close": null,
"calls_volume": 469,
"puts_volume": 116,
"total_options_volume": 585
}That is the first minute of a real session, and it is worth reading slowly. The index value had not printed yet - the feed publishes 0.0 placeholders until it does - but 585 option contracts had already traded in that minute, and four times as many calls as puts.
Notice what the API did with the placeholder: it served null, not 0.0.
A volatility index at zero is not a small number, it is a lie, and a
chart that plots it will invent a crash at 9:31 every morning. The volume
zeros, by contrast, are real zeros and stay. Both cases live in the same
bar. This is the data-honesty rule the whole layer is built on: nothing
fabricated, absences declared, placeholders converted to null, and a
missing series answering 404 rather than an empty 200 pretending
everything is fine.
A catalog you can actually walk
The index catalog grew from 35 curated symbols to 2,481 - sector baskets, country indices, single-stock volatility gauges, buy-write and target-outcome families, each with metadata and daily history on demand:
curl -H "x-api-key: YOUR_API_KEY" \
  "https://sugra.ai/api/v1/cboe\
/indices/all?q=buywrite&limit=20"
Honesty shows up here too, in a smaller way. The upstream metadata marks
currency for some indices with the literal word “dollar” - and it turns
out a measurable slice of those are Canadian. So the API does not guess:
currency is an ISO code only when the source publishes one, and the
verbatim published value always rides along in currency_raw. If we
cannot know, you get null and the raw string, not a plausible wrong
answer.
Chains sized for indices
The cash-settled index chains - S&P 500, Nasdaq-100, Russell 2000 - are
large. The S&P 500 complex alone is thousands of contracts across dozens
of expirations. The chain endpoint now carries them properly: an
expirations list is always included, and expiry=YYYY-MM-DD slices a
single expiration out of the chain, with the contract count following the
slice.
curl -H "x-api-key: YOUR_API_KEY" \
  "https://sugra.ai/api/v1/cboe\
/options/_SPX?expiry=2026-09-18"
On a recent Friday that slice returned 1,970 contracts of one expiration, out of 55 expirations on the full chain - with implied volatility, Greeks, volume and open interest on every one.
The curve, declared
Volatility futures are settlement-basis instruments: the number that
matters is fixed once a day. Rather than dress that up as a live quote,
the VX payloads declare it - price_type: "settlement", with the
settlement date alongside, and the date is only stated when it can be
verified against two independent files. When it cannot, the field is
null and the data still serves.
curl -H "x-api-key: YOUR_API_KEY" \
  "https://sugra.ai/api/v2/futures\
/VX/curve"
The curve comes back with a structure label - contango or
backwardation - computed front to back, the same way it works for crude,
gold and every other root on the futures surface. Roll cost and term
premium stop being a spreadsheet you maintain and become a field you
read.
Why the honesty rules matter for agents
Every endpoint in this layer was built for a reader that does not squint
at charts: an AI agent, or a pipeline that acts on what it parses. Squint
and you can forgive a 0.0 placeholder; parse and you cannot. The rules
this layer ships with - placeholders become null, zeros are only served
when they are true zeros, definition changes are declared in-band,
absences are 404s, T-1 data says it is T-1 - exist because an agent
believes what you return. The API’s job is to make that belief safe.
The volatility layer is live now, on every plan, behind the same key as everything else. The API reference has the endpoint-by-endpoint detail, and the free tier is enough to pull every example in this post.